Operator's Manual
CALIPER QUANT (BETA) is a quantitative chart data visualization overlay that injects directly into your broker's interface. It operates as a 100% read-only market-state auditing engine designed to observe participation, inventory proxies, liquidity conditions, and cross-board telemetry against dynamic Volume, ATR, and VWAP baselines.
The Fragmentation Problem
Why legacy retail workflows fail to provide quantitative clarity.
The Broken Workflow
Modern traders rely on a fragmented suite of tools: Price Charts, Volume Bars, Lagging Indicators, Scanners, News, and Option Chains.
Yet they still encounter:
- ✕ Contradictory signals across timeframes.
- ✕ Hidden participation mismatches (False Breakouts).
- ✕ Cross-board conflicts (NSE vs. BSE liquidity divergence).
- ✕ False, unsupported technical breakouts.
The CALIPER Consolidation
CALIPER replaces the scattered dashboard. It consolidates these fragmented observations into a single, unified mathematical audit framework natively over your chart that appears when you click a ticker & then vanishes when anything on screen other than the ticker is clicked.
The Operational Purpose
Why operators utilize this architecture to evaluate risk.
1. Structural Exploitation
CALIPER does not "hunt" for setups; it calculates the underlying market physics. When a price expands but the Relative Volume (RVOL) remains dormant, the quantitative engine explicitly translates this mathematical condition as a FALSE BREAKOUT. A sophisticated operator leverages these deterministic observations, recognizing the volumetric anomaly to independently assess unbacked retail flow.
2. Structural Validation
Market structure is governed by volumetric gravity and fair value. The terminal continuously anchors the live asset price against the Volume-Weighted Average Price (VWAP) and the Volume Point of Control (POC). By measuring the statistical stretch (Z-Score) away from these non-derivative centers of mass, the engine evaluates whether current price expansion is supported by the measured statistical and volume conditions.
3. Micro-Structure Reading
Zooming into tight temporal horizons, CALIPER processes high-frequency tick data through localized ATR and fractional RVOL thresholds. This exposes the micro-physics of price action—revealing rapid volatility contraction (coiling), VWAP-constrained price behavior, and climax absorption phases before price action reflects the underlying kinetic shift.
The Quantitative Foundation
CALIPER QUANT contains no black-box magic and no opaque AI interpretation. The engine combines established technical-analysis concepts, practitioner methodologies, and proprietary quantitative heuristics.
The Four Physical Anchors (Mental Models)
1. Z-Score (The Rubber Band)
Measures how many standard deviations price is away from historical fair value. At 0σ, price is stable. At +2.5σ, the rubber band is dangerously stretched upward, flagging conditions historically associated with mean-reverting snapbacks.
2. RVOL (Relative Volume Footprints)
Isolates high-conviction effort from baseline market noise. Divides current bar volume by the trailing average volume for that exact time of day. <0.8x indicates dead tape, while >1.5x signals massive relative volume participation.
3. VWAP & Volume POC (Gravity Magnets)
Volume-weighted baselines. Volume Point of Control (POC) identifies the exact price node containing the highest density of exchanged shares—acting as heavy resistance if price attempts to rise into trapped overhead supply.
4. ATR Stop Floor (Breathing Room)
Multiplies the asset's ATR-derived volatility baseline to construct a dynamic, trailing risk floor. This mathematical boundary filters out standard oscillation, keeping you in trends until a true structural breakdown occurs.
Literature Attribution Matrix
J. Welles Wilder (1978)
Establishes standard directional movement (ADX) and spatial velocity limits (RSI 30/70 bounds) to identify directional extremes and momentum exhaustion.
Richard D. Wyckoff (1931)
Applies the Law of Effort vs. Result via Relative Volume (RVOL) to isolate price-volume behavior consistent with absorption, distribution traps, and unsponsored price moves.
Dr. Larry Harris (2002)
Quantifies algorithmic TWAP/VWAP execution brackets, identifying price compression around VWAP, consistent with execution-related microstructure phenomena.
Dr. Ernest P. Chan (2008)
Utilizes rolling Z-Score standard deviations (≥2.50σ) to mathematically isolate extreme spatial tail events historically prone to mean reversion.
Victor Sperandeo (1991)
Translates the 2B reversal pattern into quantitative logic, classifying breakouts that lack baseline volume sponsorship as high-risk false breakouts.
J. Peter Steidlmayer (1985)
Evaluates overhead supply and support density by anchoring live price to the highest-density volume node (Volume Point of Control / POC).
Crabel (1990) / Carter (2005)
Analyzes localized liquidity vacuums (NR4/NR7 and ATR compression thresholds) that structurally precede violent directional standard deviation expansion.
Stan Weinstein (1988)
Categorizes primary structural market phases (Stage 2 Markups vs Stage 4 Markdowns) using long-term 200-period macro moving average baselines.
Anomalous & Microstructure Edge Cases
How CALIPER interprets non-standard structural conditions.
Float Rotation Override
If an asset trades $>100\%$ of its available free float in a single session, standard technical indicators mathematically break. The engine detects this extreme supply/demand shock and immediately overrides standard deviation parameters to isolate absolute volume anomalies.
Anomalous Liquidity Sweeps
CALIPER identifies anomalous liquidity sweep patterns. If a stock experiences a violent parabolic Z-score dislocation ($>2.5\sigma$) on climax volume, but the ADX reads dormant (indicating no existing trend duration), it is identified as a liquidity-sweep-like anomaly.
Adaptive Scaling
RVOL is not a static number. The engine dynamically sorts historical volume into percentile brackets (20th, 50th, 90th, 98th) to adapt to the asset's specific liquidity regime, preventing false "climax" classifications on inherently high-volume blue-chip equities.
What CALIPER Is Not
Protecting your execution from false expectations.
✕ Not an Algo Trader
CALIPER does not execute orders, manage portfolios, or access your broker's funds. It is 100% read-only decision support.
✕ Not an Advisory Service
It does not issue buy, sell, or target recommendations. NULL Microsystems is a quantitative software developer, not a registered financial advisory or brokerage entity.
✓ Market-State Telemetry
It is a strictly defined chart data visualization utility that processes real-time statistical volume anomalies and dynamic standard deviations to render a physical map of price-volume dynamics.
Why It Skips MACD & Fibonacci
Direct observation and statistical logic.
The Derivative Lag Trap
Traditional oscillators like MACD process historical closes through smoothing averages, creating inherent temporal lag. CALIPER bypasses black-box smoothing distortions, measuring the observable physical state of the market.
Direct Observation & Statistical Logic
Caliper combines raw market observations with derived statistical measures and state-based logic. By anchoring to statistical mechanics (Z-Score from VWAP, Relative Volume), it maps actual kinetic energy expenditure and structural stretch in real-time.
Breathing Volumetric Baselines
Static levels (like Fibonacci retracements) force subjective, frozen geometry onto dynamic markets. CALIPER evaluates continuous, breathing parameters where baseline thresholds (ATR, Average Volume) adapt fluidly against the active market horizon.
The System Controls
How you interact with the engine's telemetry.
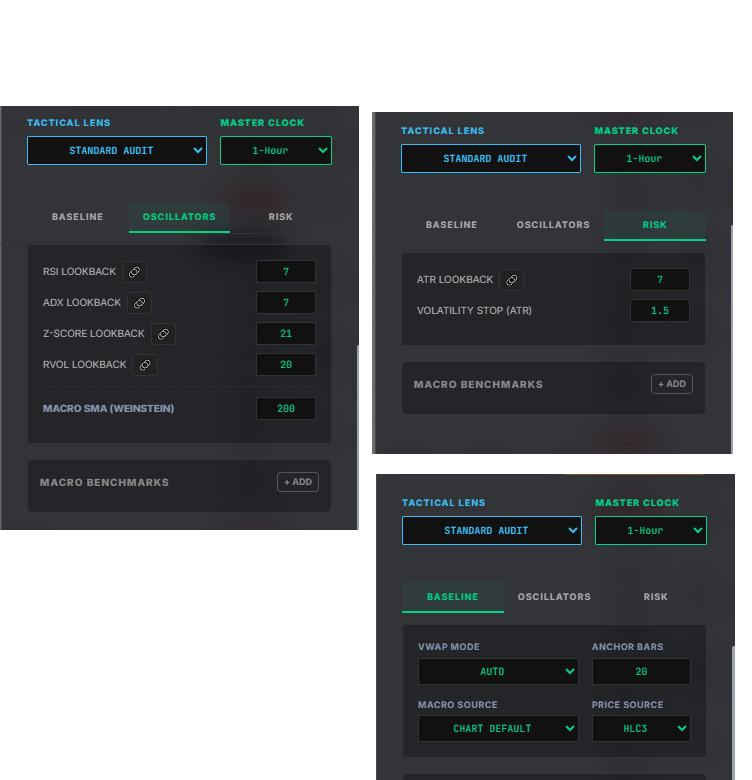
The Master Clock
Decouples execution timeframes from macro physics. You can manually adjust lookback horizons (e.g., locking RSI/ADX from 14 to 7 bars) to make the telemetry hyper-reactive to localized price action without changing your chart.
Tactical Lenses
Switch from standard macro mapping to specialized anomaly observation. Each lens runs distinct mathematical parameters to isolate specific market geometries (like Value Vacuums or Floor Breaches).
// Operator's Agency & Structural Bias Notice
CALIPER QUANT is a chart data visualization framework processing real-time market physics telemetry. All outputs evaluate dynamic, breathing baselines of Relative Volume (RVOL), Average True Range (ATR), and Volume-Weighted Average Price (VWAP). Volume is the most critically ignored parameter in retail trading because raw volume bars lack relative context. CALIPER elevates Volume to the ultimate baseline—the foundational physics of the market. Confluences and quantitative verdicts only populate the matrix when real-time RVOL and ATR physically intersect with statistical price deviations. The system provides raw, literature-backed computational observations—it does not issue directive buy, sell, or target advice. The software provides observational telemetry; risk strategy belongs entirely to the operator.
The Reading Order (Baseline Protocol)
- 1. Caliper observes: Ensure CALIPER has locked onto the active chart asset.
- 2. Caliper quantifies: Observe the primary Confluence Audit Box for macro state classification.
- 3. Caliper classifies & explains: Verify trend kinetics (ADX, Z-Score) and volume conviction (RVOL).
- 4. The operator decides, sizes, enters, & exits: Apply your personal trading setup based on the interpreted telemetry.
// Timeframe & Bar Physics Hierarchy
-
Bar Incubation & Noise Invalidation Gate (Maturity < 22%):
Live, unclosed bars are subjected to a strict chronological threshold gate. If a newly printing bar is less than 22% mature (e.g., under 66 seconds on a 15-minute bar, or under 79 minutes on a daily candle), the engine identifies it as pure high-frequency noise and triggers the
shouldPoproutine. The incomplete bar is sliced off calculation arrays entirely, forcing all oscillators (RSI, ADX, Z-Score) to resolve strictly against the last *fully closed* historical data boundary. - Sigmoid Proration Pipeline (Maturity ≥ 22%): The moment an unclosed bar crosses the 22% maturity benchmark, it is admitted into the active data matrix with fractional weight derived from a specialized Sigmoid confidence curve. Every historical bar carries a static vote weight of 1.0, while the live breathing bar's weight smoothly scales up this curve.
- Daily Lens (1D Horizon): Defines the overarching macroeconomic structural regime and baseline trend tracking vectors.
- 15-Minute Clock: Serves as a primary structural horizon for analyzing distribution-like price-volume behavior and Session VWAP dynamics.
- 5-Minute / 2-Minute Clock: Hyper-reactive execution monitors deployed to evaluate localized market geometry and micro-liquidity conditions.
Audits directional coupling. Telemetry above +70% identifies benchmark beta dependency, while values within ±30% isolate uncorrelated idiosyncratic flow.
Calculates intermarket relative-rotation conditions via standardized spreads. Positive readings over +1.5σ indicate risk-on equity outperformance, while drops below -1.5σ indicate a negative rotation regime.
Tracks localized currency interaction (USD/INR). Readings exceeding +30% indicate inflationary pressure in domestic cyclicals, while values under -30% are consistent with external-flow pressure.
Calculates cross-sectional sector dispersion. Synchrony over 65% indicates broad-market participation, while values under 35% expose concentrated index breadth.
The Translation Engine
Every CALIPER verdict is built on five structural pillars. This helps you evaluate market structure.
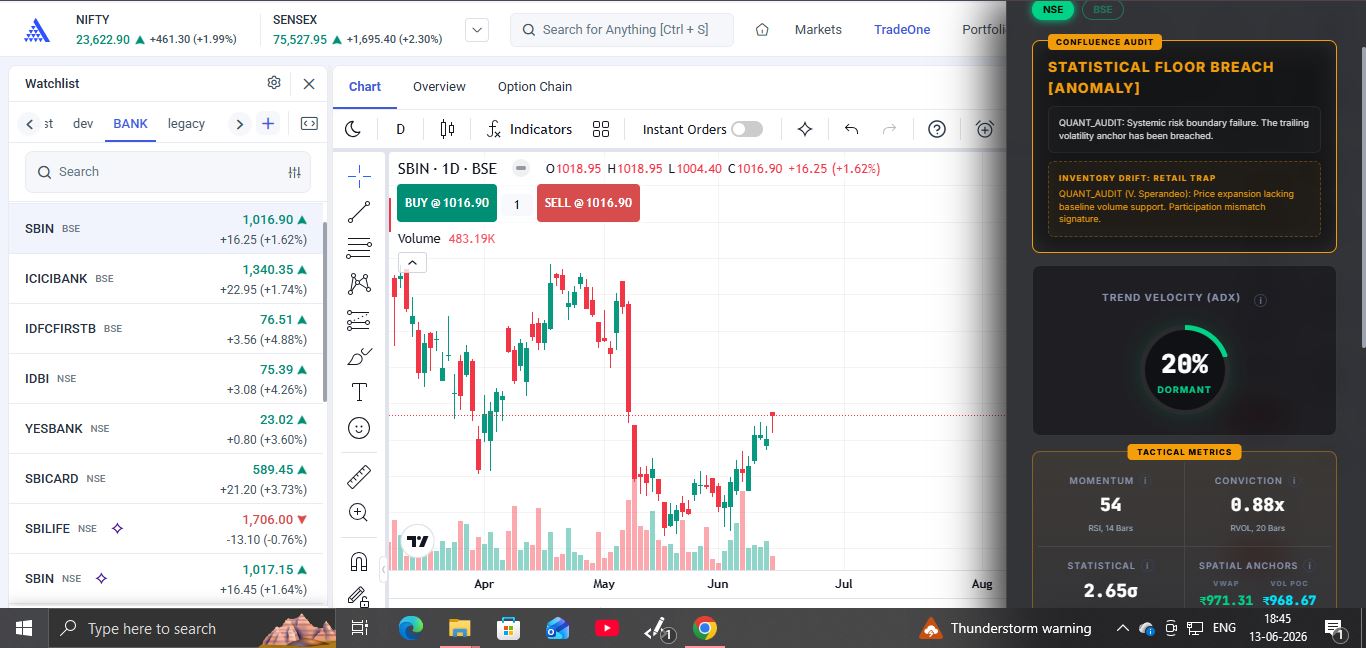
Floor Breach + False Breakout
The terminal frequently outputs compound states. The primary line indicates macro structural boundaries, while sub-surface telemetry reveals participation dynamics.
1. The Math (The Engine's Read)
Z-Score is stretched (2.65σ), ADX is dormant (20%), and volume is sub-par (0.88x).
2. The Primary Verdict
STATISTICAL FLOOR BREACH: Trailing volatility anchor has snapped, indicating a pattern consistent with structural trend deviation.
3. The Sub-Surface Drift
FALSE BREAKOUT: Price expansion is occurring without baseline volume participation. Volume participation does not support continuation.
The Final Telemetry Reading
"The asset has pushed to a statistical extreme without organic volume sponsorship. The system classifies this as an unsponsored price expansion, giving the operator real-time mathematical context."
Statistical Floor Breach
How the engine quantifies absolute structural boundary failures using trailing volatility anchors.
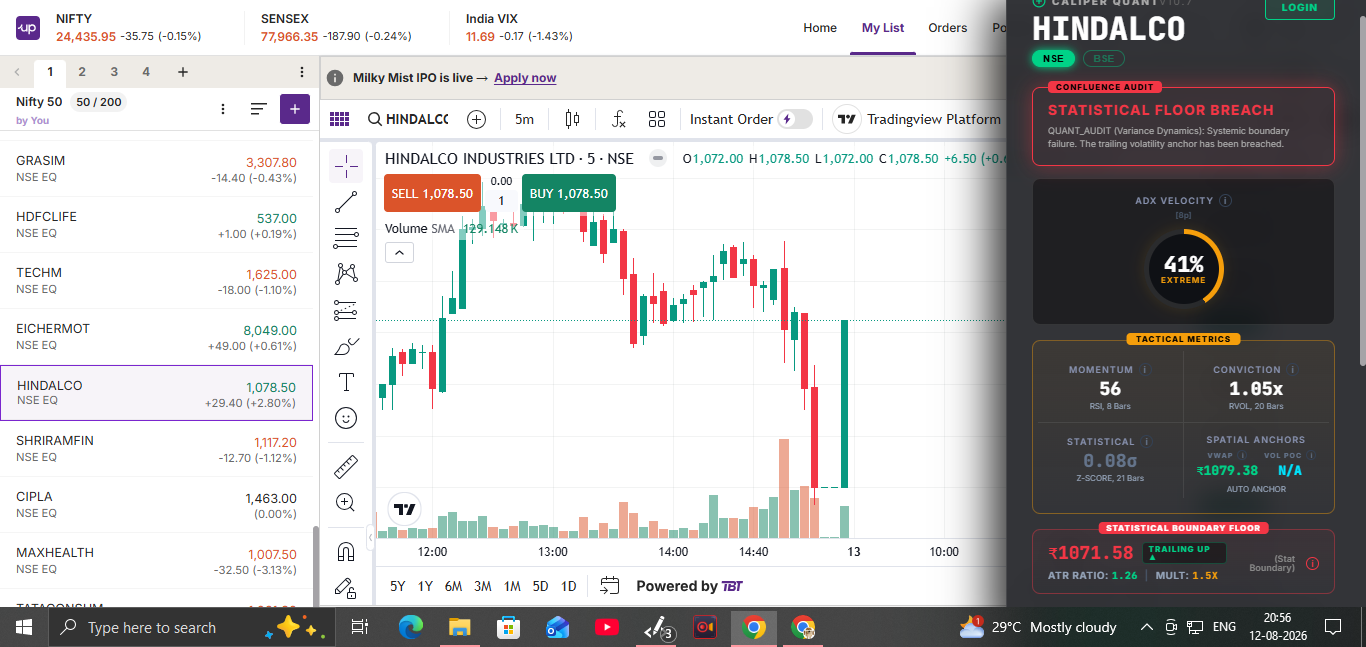
The Calculation Sequence
A STATISTICAL_FLOOR_BREACH acts as a dynamic tripwire governed strictly by the asset's ATR-derived historical volatility baseline.
1. The Anchor
During an uptrend, the engine establishes a safety net below the current price. This floor is calculated by extracting the asset's Average True Range (ATR), multiplying it by a chosen scalar (e.g., 1.5x), and trailing it upward beneath the price action.
2. The Breach
The state is triggered exclusively when the active price drops strictly below this mathematical stopFloor boundary, forcing the polarity state to flip downward.
The Implications: Regime Shift
- Variance Exhaustion: It implies the downward price movement has exceeded the boundaries of normal, healthy market noise (routine pullbacks). The asset has violated its own historical volatility parameters.
- The "Trap" Caveat: The engine features a volumetric counter-measure. If the breach occurs on dead/dormant volume, the Sperandeo logic intercepts it and labels it a STATISTICAL FLOOR BREACH [ANOMALY] (indicating Exhausted Selling or a False Breakout).
Same Asset. Different Clock.
Different horizons reveal different layers of market structure. Observe how the engine classifies the exact same asset across different clocks.
The Macro Horizon
Viewed through the macro daily lens, the multi-day rally is identified as an unsponsored expansion due to dormant velocity and extreme stretch.

The Intermediate Horizon
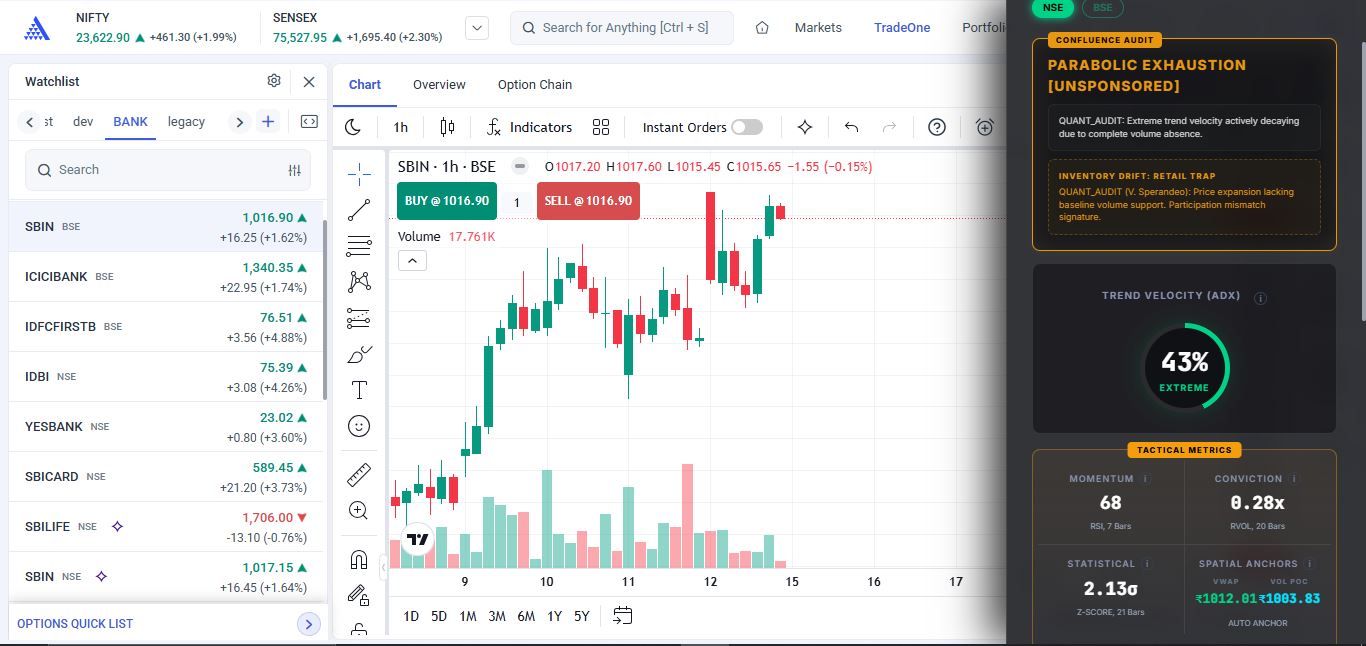
On the 1-Hour clock, a localized advance is observed, but volume remains deficient, supporting the daily chart's indication of thin participation.
The Hypersensitive Horizon
Tightening lookbacks from 14 to 7 bars makes the engine hyper-reactive, classifying the recent advance as a parabolic exhaustion spike.
Operational Case Archives
Empirical documentation of telemetry performance across structural horizons and market anchors.
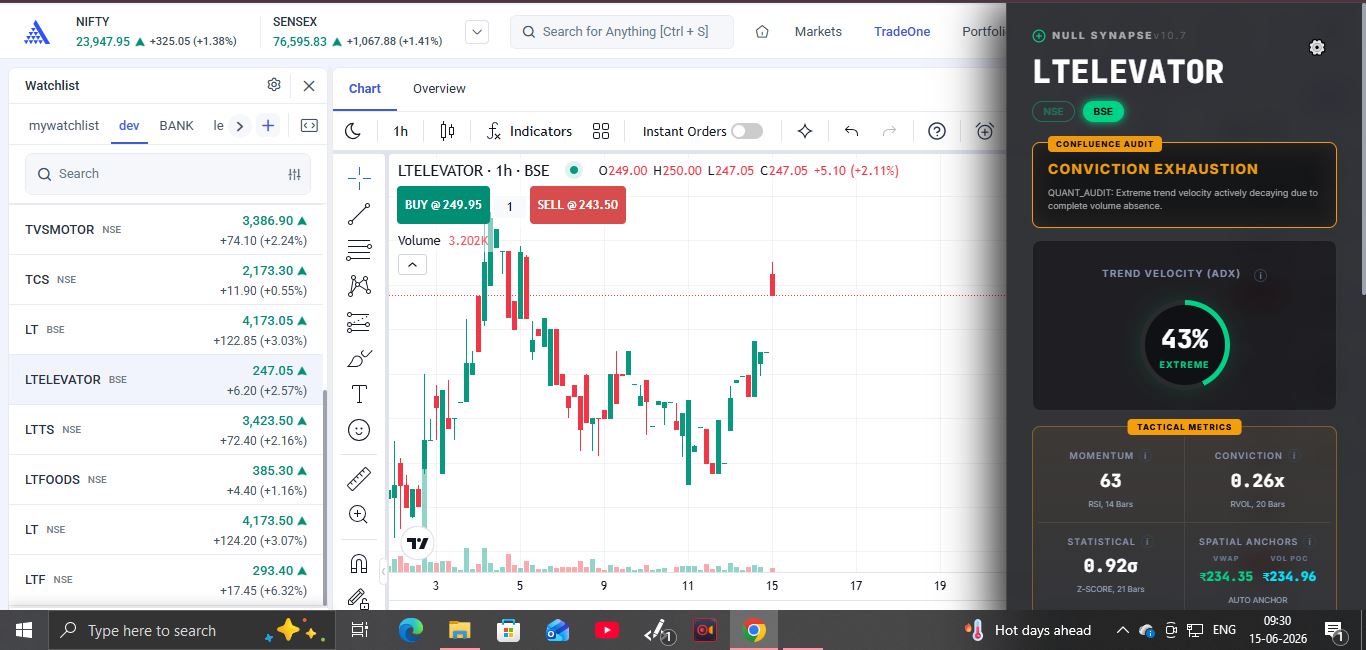
LTELEVATOR: Overnight State Tracking
Slicing target assets across multi-layered tactical lenses simultaneously evaluates structural conditions into a composite matrix of kinetic energy and participation.
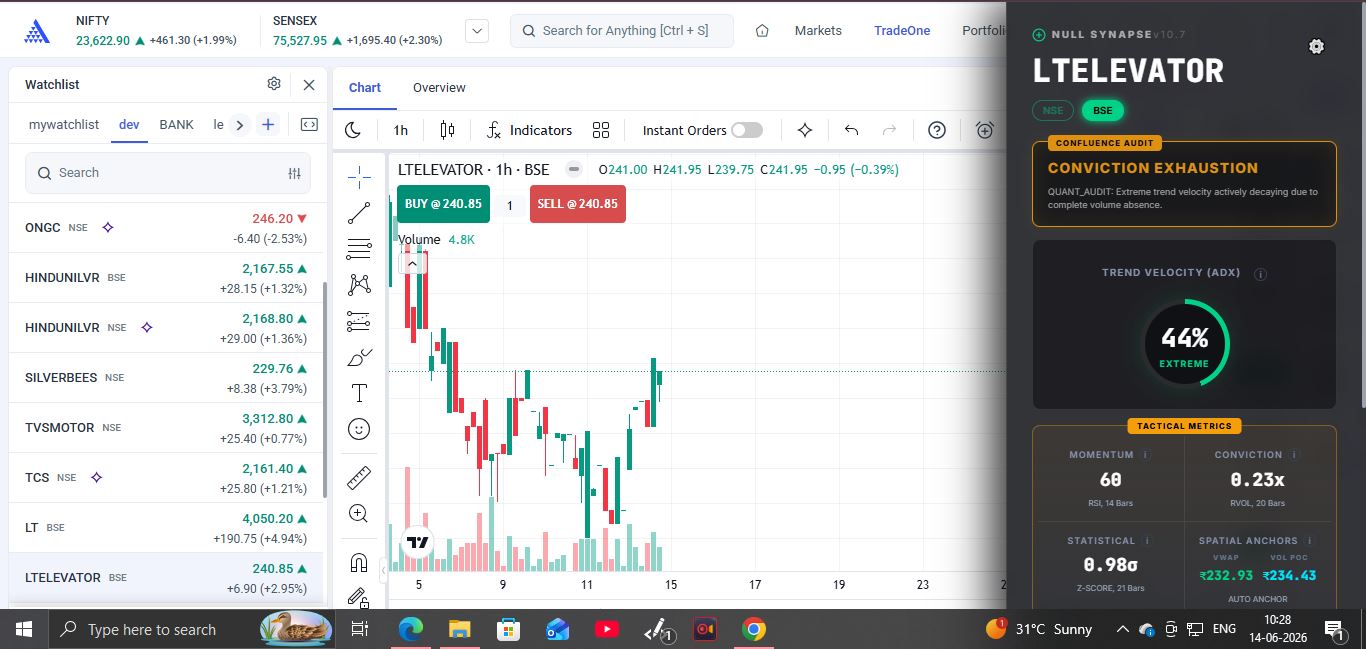
- RVOL: 0.23x
- ADX: 44% (Extreme)
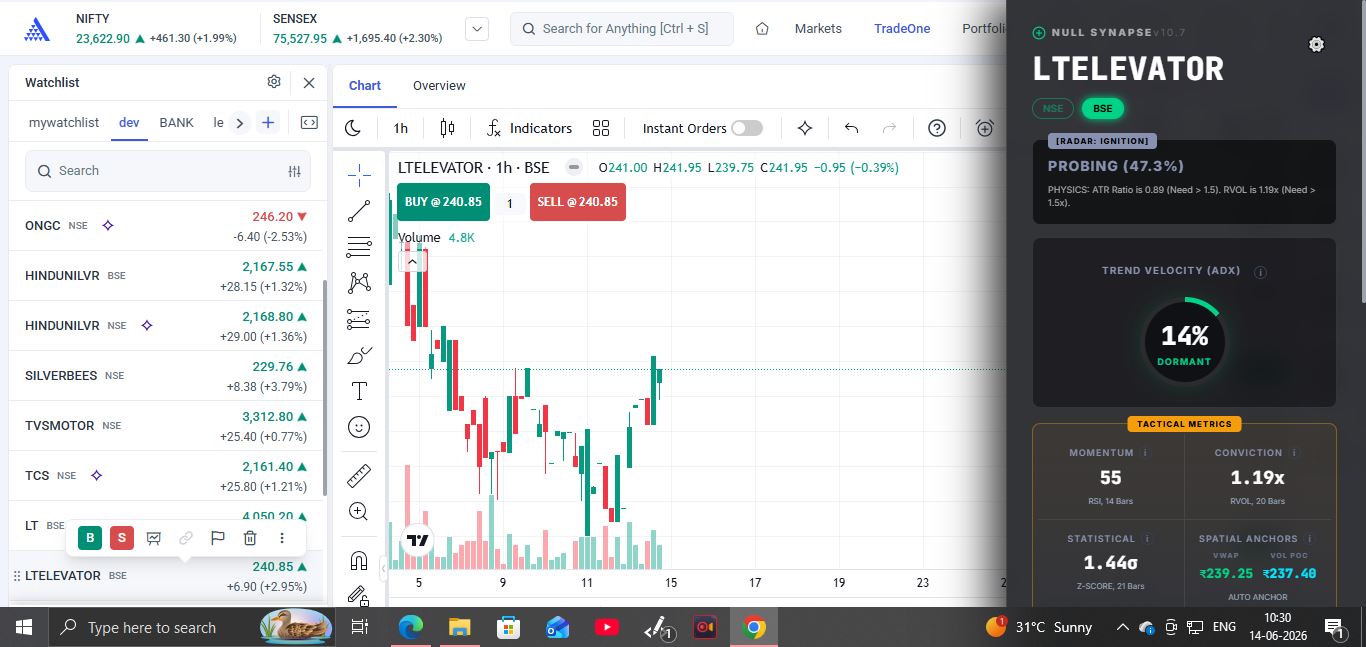
- RVOL: 1.19x
- ATR: Insufficient
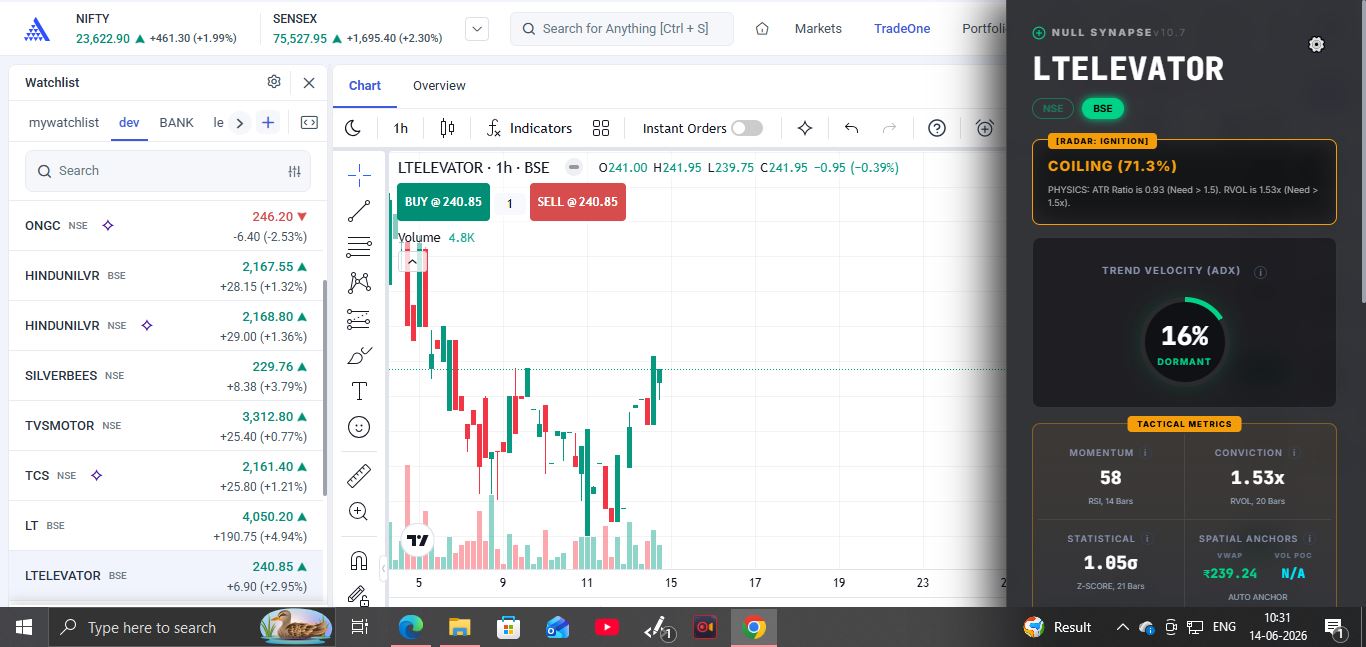
- RVOL: 1.53x
- ADX: Dormant
The Composite Telemetry Reading
CALIPER delivers quantitative market-state observations: The hourly macro trend is volume-deficient (Conviction Exhaustion), while short-horizon micro-liquidity is compressing (30M Coiling). The telemetry profiles an expansion state encountering immediate supply overhead.
Market Resolution
The compressed 30-minute energy discharged at open, creating a gap up. However, the 1-Hour Macro Engine remained locked in CONVICTION EXHAUSTION due to deficient volumetric participation (0.26x RVOL), alerting the operator to the unsponsored nature of the move.
ASIANPAINT: Decoupled Macro Anchoring
By unlinking tactical analytics from local execution clocks, operators monitor micro market geometry while keeping mathematical risk parameters anchored to macro liquidity boundaries.
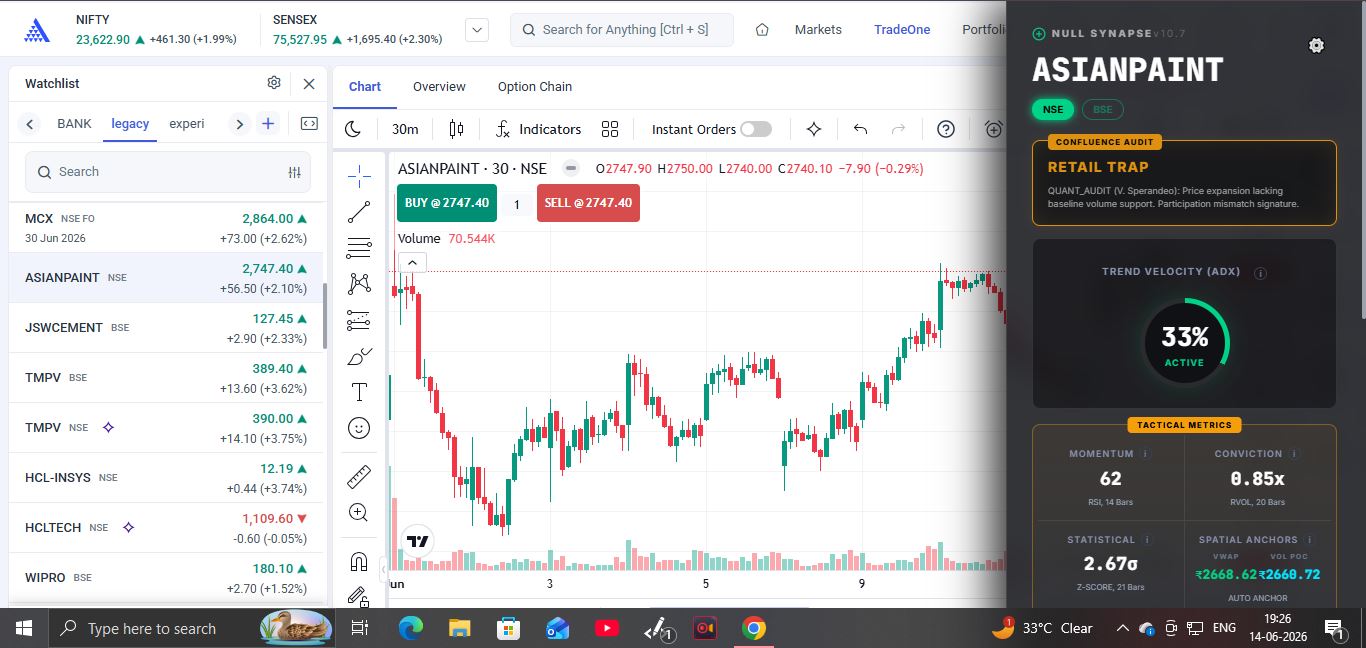
- Z-SCORE: 2.67σ (Extreme Stretch)
- RVOL: 0.85x (Deficient)
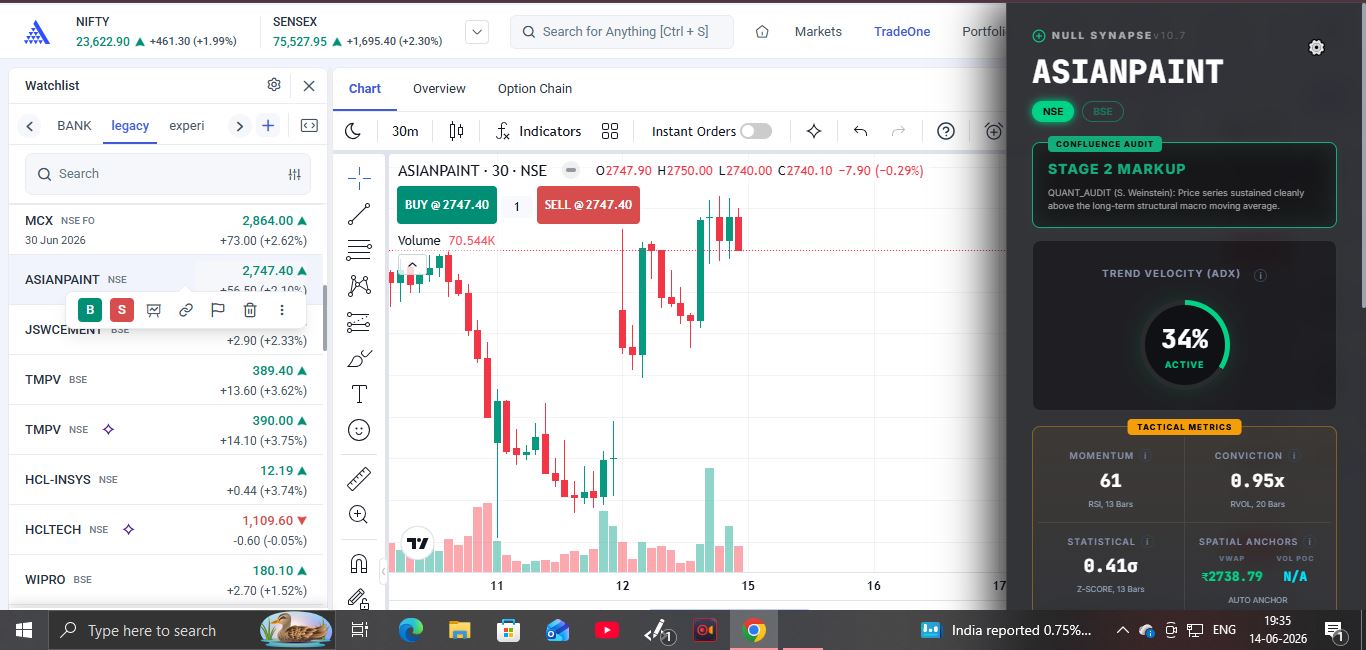
- Z-SCORE: 0.41σ (Equilibrium)
- ADX: 34% (Strong Trend)
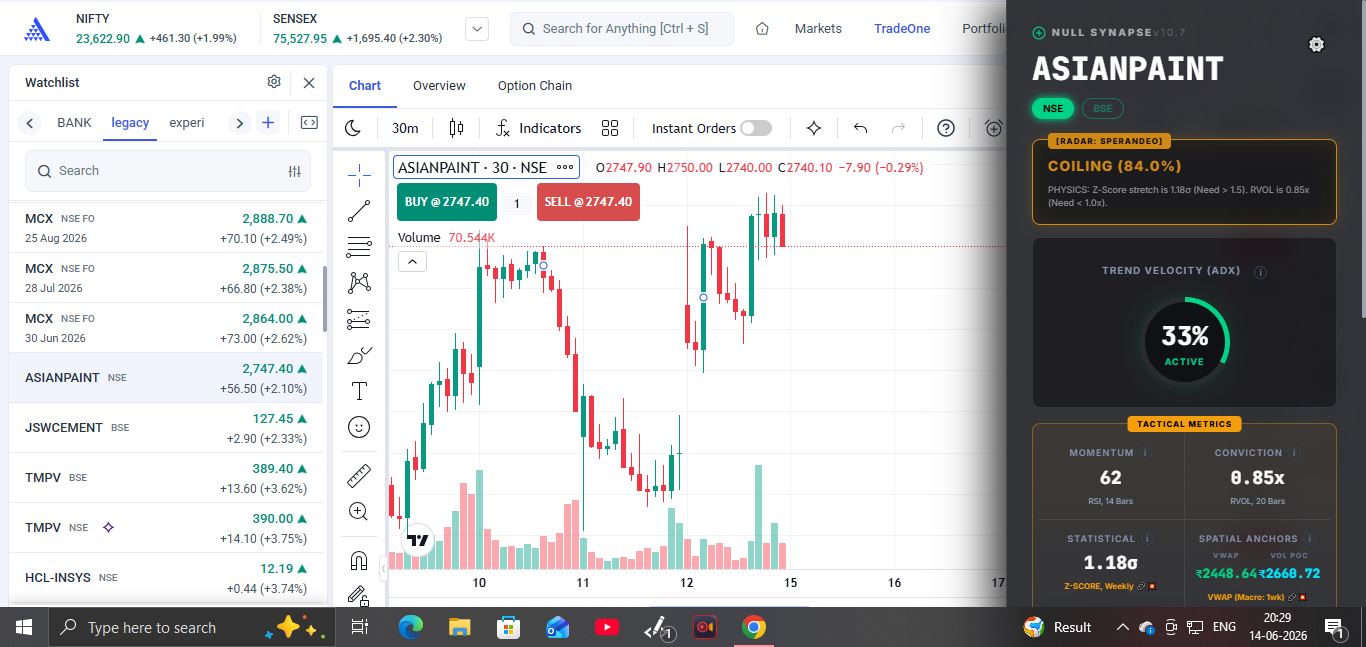
- ANCHOR: Weekly Z-Score (1.18σ)
- RVOL: 0.85x
The Tactical Edge
Decoupling primary engine metrics from local chart limitations transforms the framework into a forensic scope. It locked onto an 84.0% alignment state, isolating the precise mathematical coordinate where the 30-minute retail markup pattern met the unbacked macro structure.
The Resolution
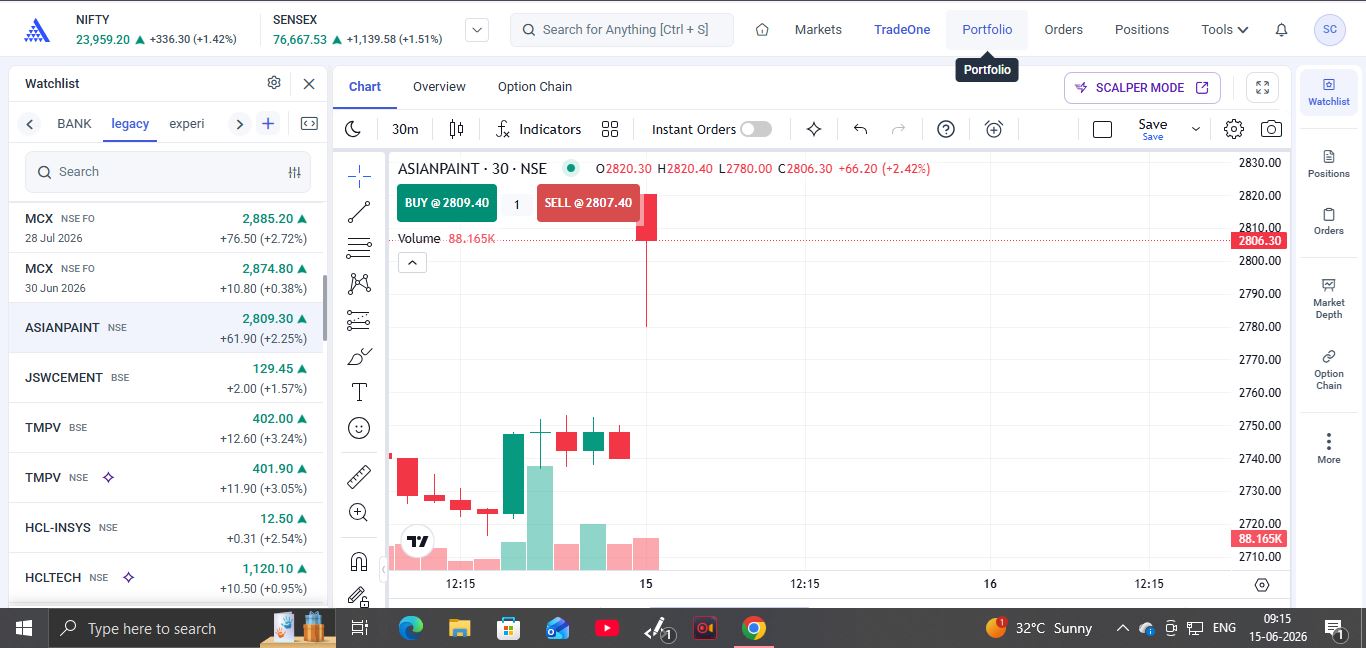
The open saw a gap expansion. Breakout logic triggered across retail systems, driving momentum-chasing buyers to absorb the open. Instantly, aggressive sellers unloaded volume into the unbacked demand.
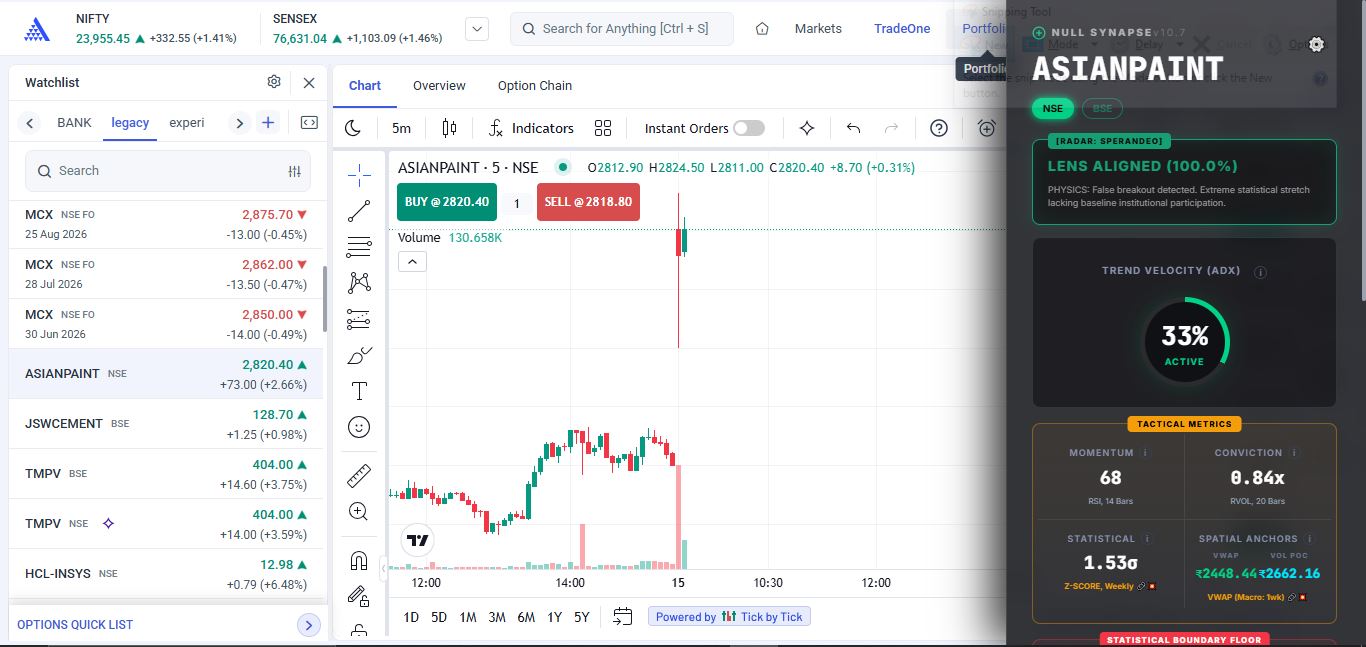
Natively inside the interface, the engine identified the structural anomaly in real time. The moment price breached the volatility envelope, the Weekly Z-Score hit a critical 1.53σ threshold on dead 0.84x volume, flashing STATE: LENS ALIGNED (100.0%).
SILVER: Asymmetric Correlation Decay
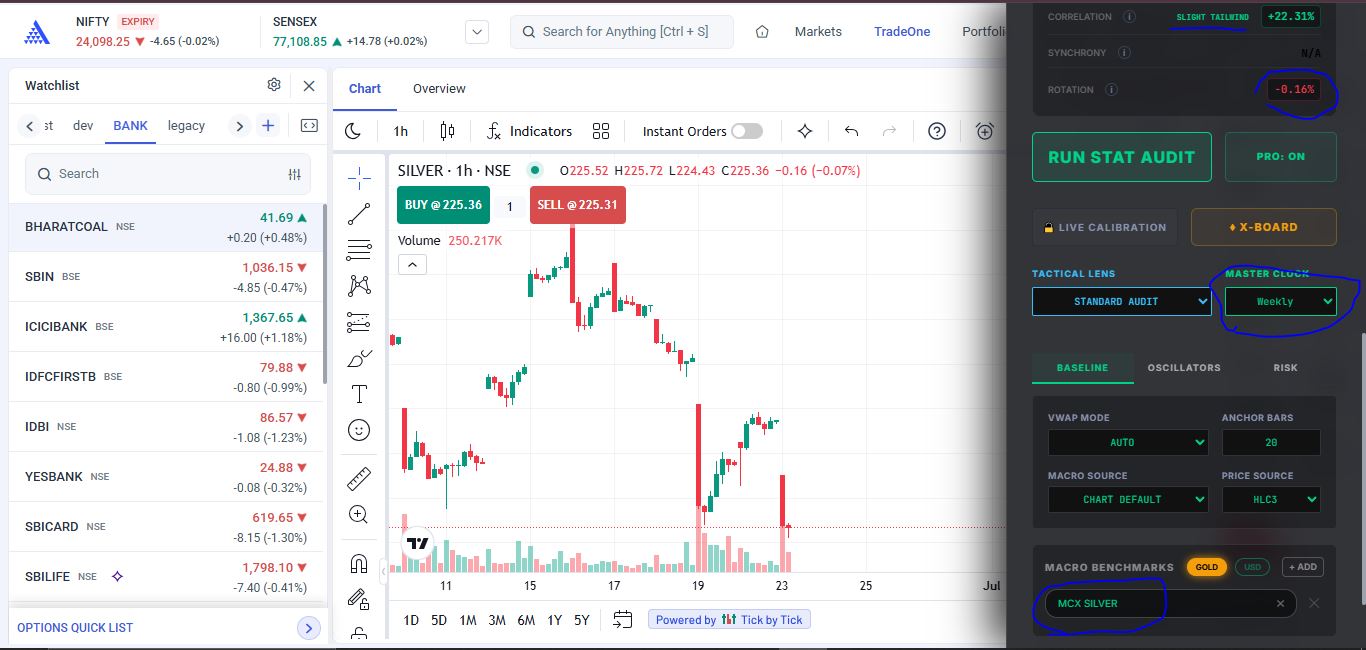
While the previous asset demonstrates time-tiered velocity decay within a single price-volume dynamic, Silver exposes severe, structural Correlation Fragmentation bridging entirely disconnected asset-class infrastructures.
1. The Asset Disconnect
SILVER (NSE) acts purely as an equity-style cash ETF instrument, while MCX SILVER processes raw commodity future contracts. Over a macro lookback window, tracking variance and disparate clearing desk participants degrade their underlying core correlation to a highly fragmented +22.31%.
2. The Global Dollar Drainage Anchor
Global environmental rotation metrics settle tightly at a negative -0.16% tracking delta relative to the US Dollar Index (DXY). Broad intermarket liquidity anchors are tightening aggressively.
WIPRO: Negative Sectoral Rotation
When an asset experiences a violent gapping threshold or morning collapse, retail instinct is to "buy the dip" under the assumption of a mean-reversion overreaction. CALIPER highlights that the observed price weakness coincides with negative sectoral rotation and strong benchmark coupling, providing additional context for an operator's independent risk assessment. Review the live engine recording below.
- STATE: Sperandeo (Floor Locked)
- Z-SCORE: -1.38σ (Contraction)
- DEFAULT: NIFTY 50 (Ignored)
- TARGET: NIFTY IT (Selected)
- ROTATION: -2.1% (Severe Defensive)
- CORRELATION: +0.91 (Highly Synergistic)
The Tactical Edge
Without CALIPER, an operator buys the support level, assuming the morning panic will subside. Armed with the Indice correlation, the operator independently evaluates that this is not an isolated stock panic—it is a strong negative rotation regime relative to the selected benchmark. The system formally categorizes the environment as a Stage 4 Markdown running on negative systemic rotation. The operator integrates this telemetry to independently assess the risk of a continuation.
TITAN: Multi-Clock Microstructure Invalidation
Slicing an identical execution footprint across multiple temporal frameworks reveals the complete computational layout. Observe how the engine simultaneously processes macro structural decay alongside hyper-reactive microstructure parameters.
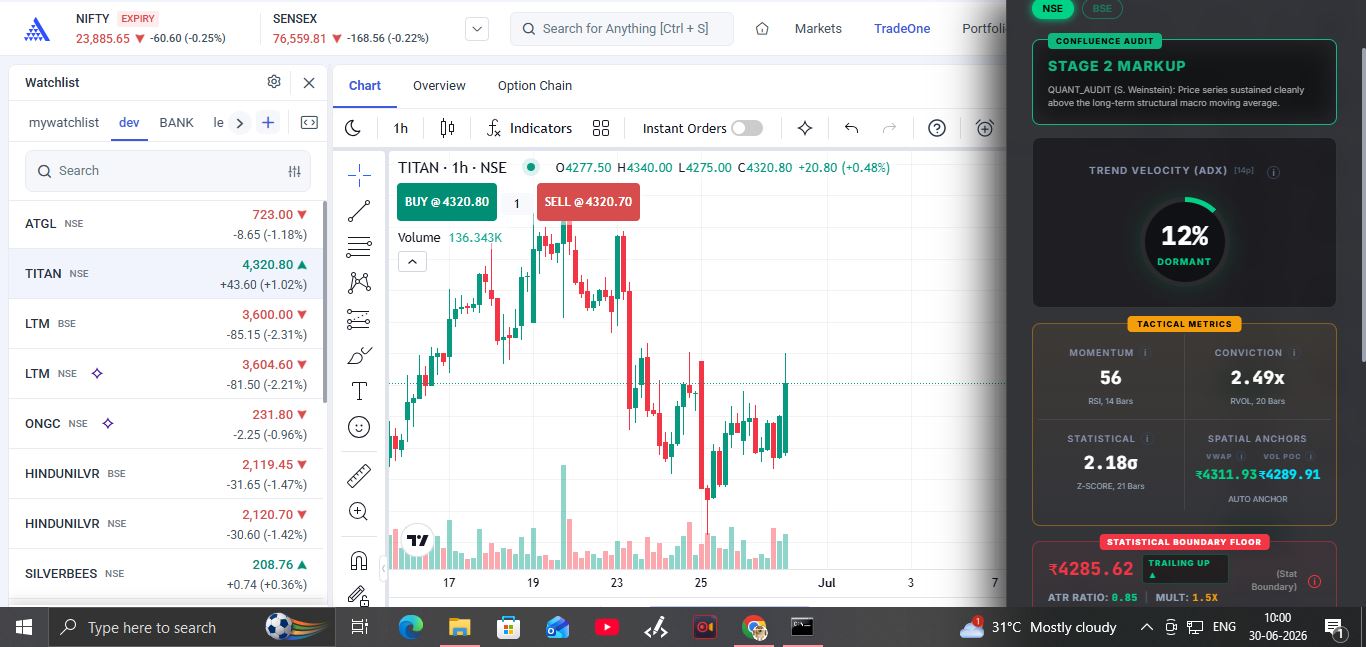
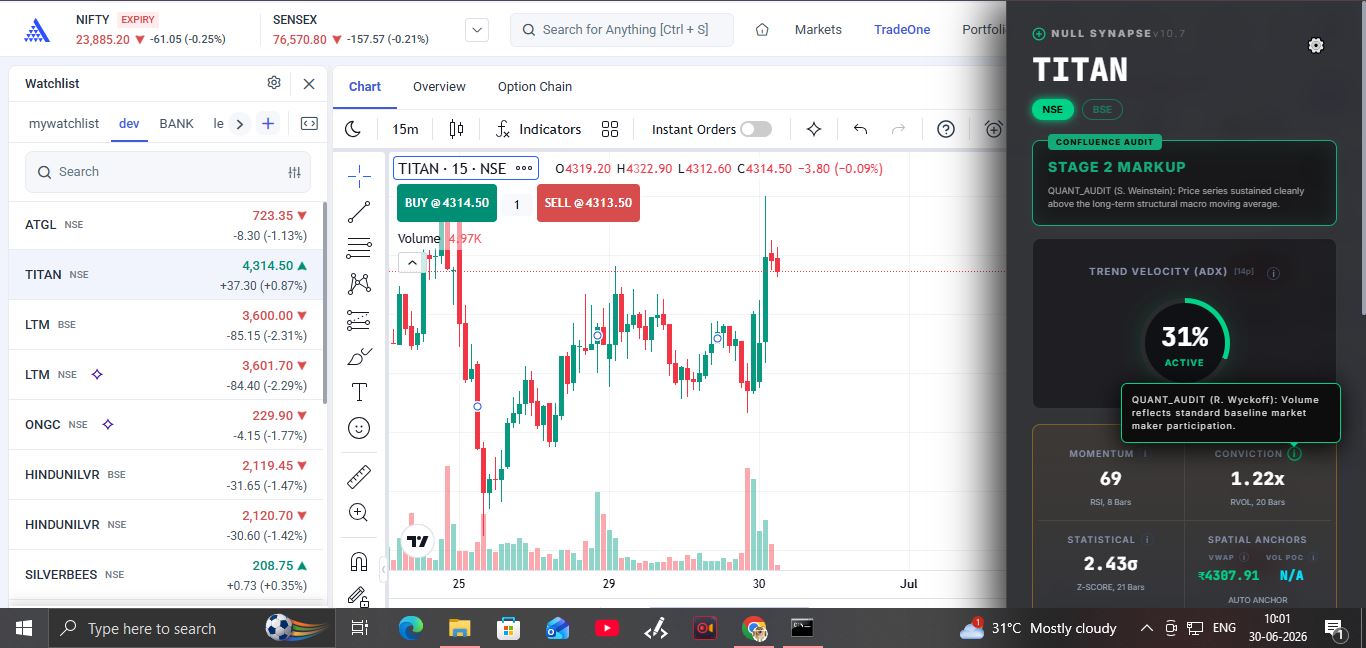
- STATE: Floor Breach [Anomaly]
- Z-SCORE: +2.81σ (Extreme Stretch)
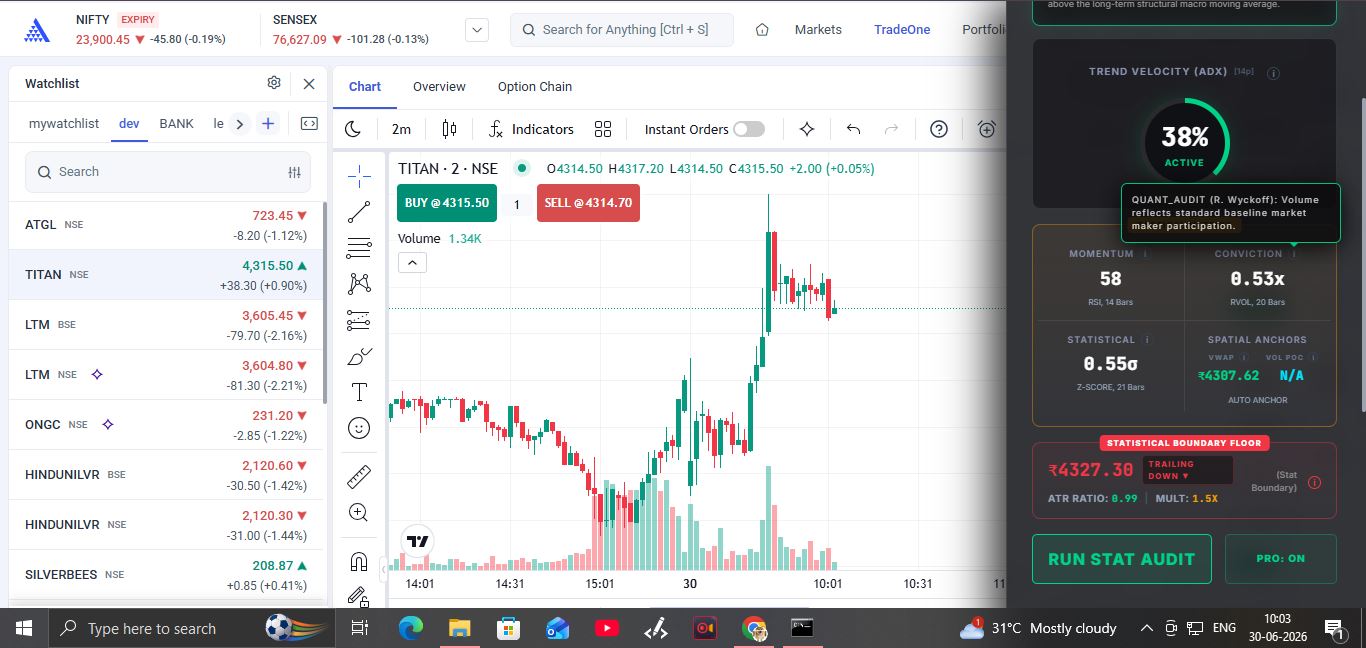
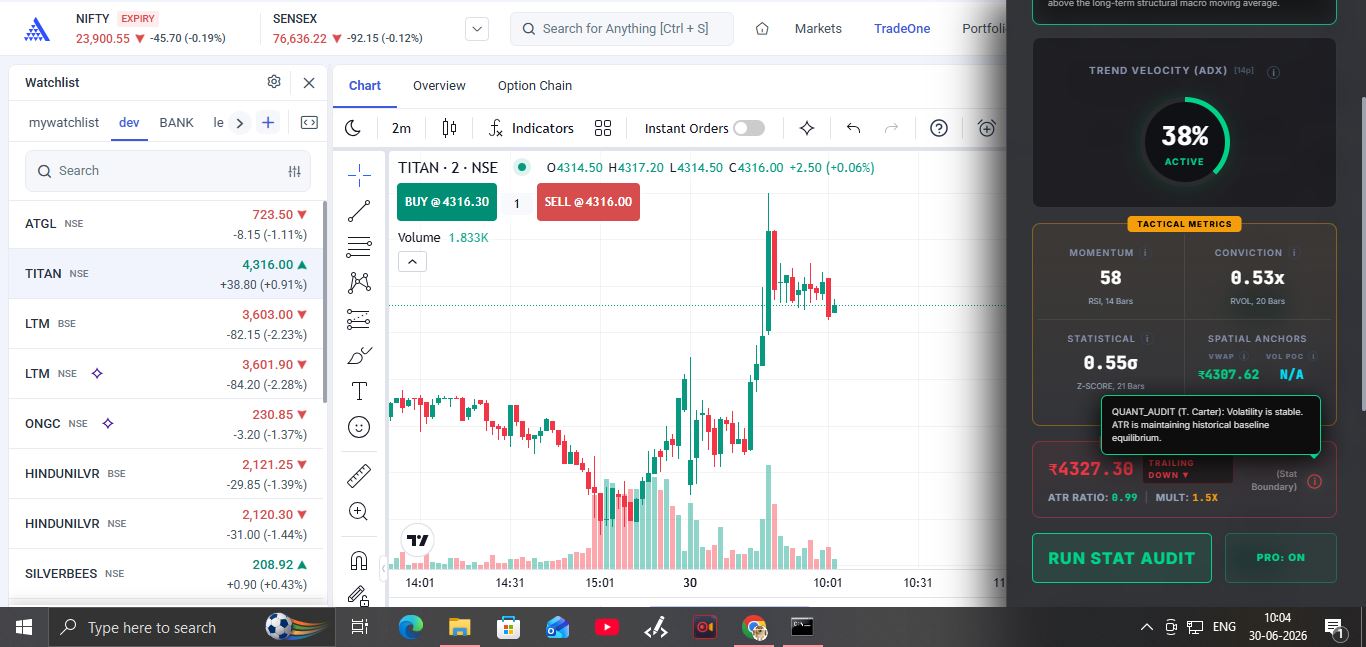
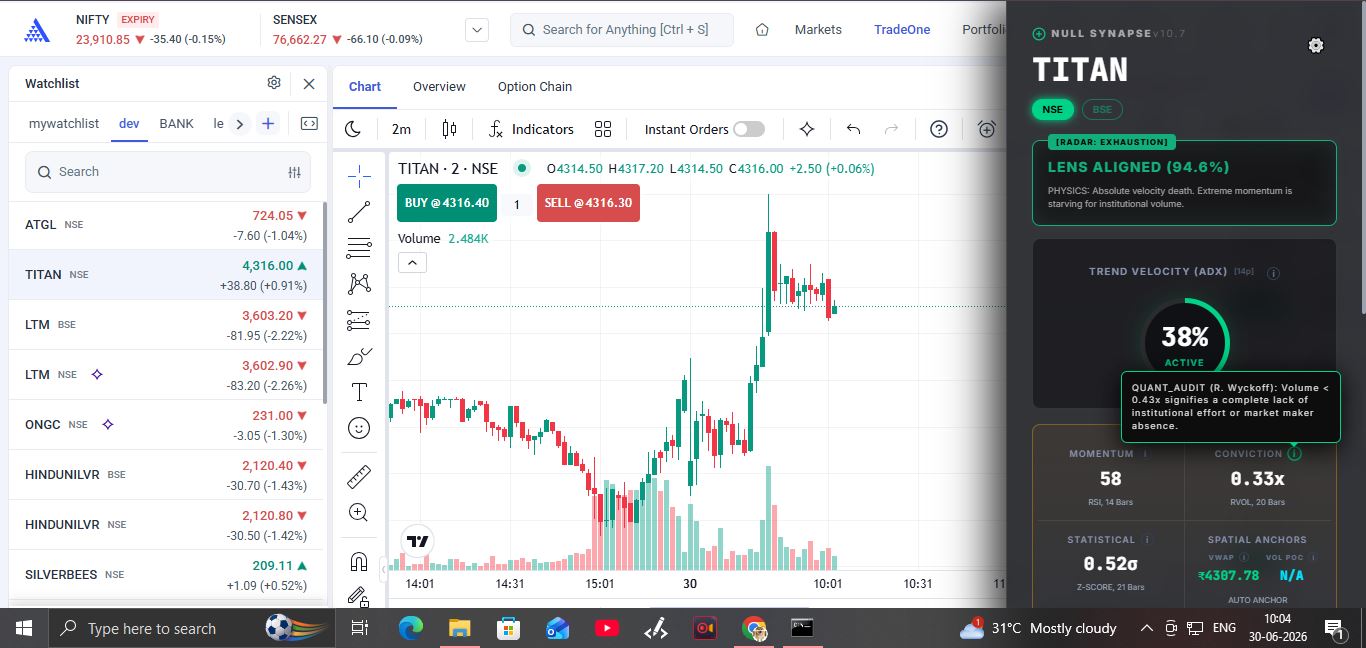
- RVOL: 0.08x (Absolute Starvation)
- ADX: 51.4% (Velocity Peak)
The Unified Resolution
The Master Clock layers match perfectly. The 1-Day clock identifies the overarching rally as a long-term structural trap. The hyper-reactive 2-Minute lens pinpoints the exact minute of execution failure, capturing maximum parabolic exhaustion into empty price-volume dynamics.
ICICIBANK: Multi-Clock Structural Absorption
Evaluating identical price action across distinct temporal horizons reveals how the engine layers different physical laws—specifically incorporating Wyckoff volume kinetics—to decode underlying price-volume behavior consistent with an absorption hypothesis.
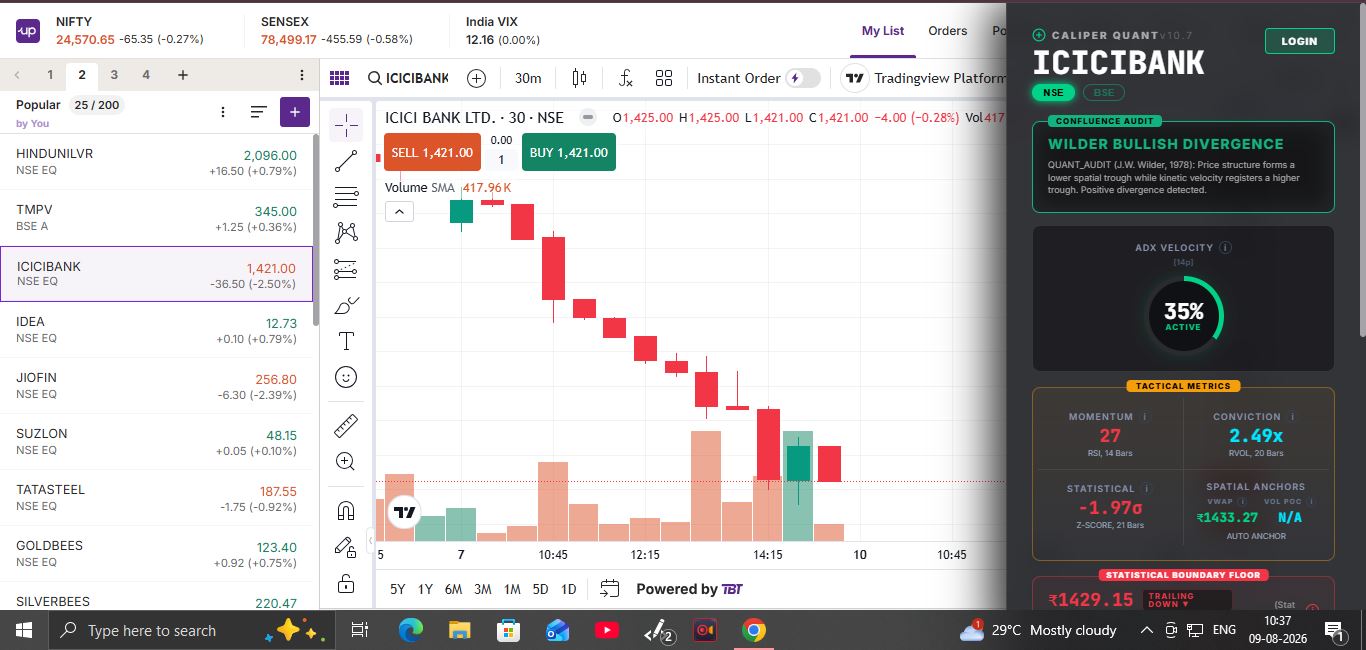
- STATE: Divergence [Absorption]
- Z-SCORE: -1.97σ (Extreme Stretch)
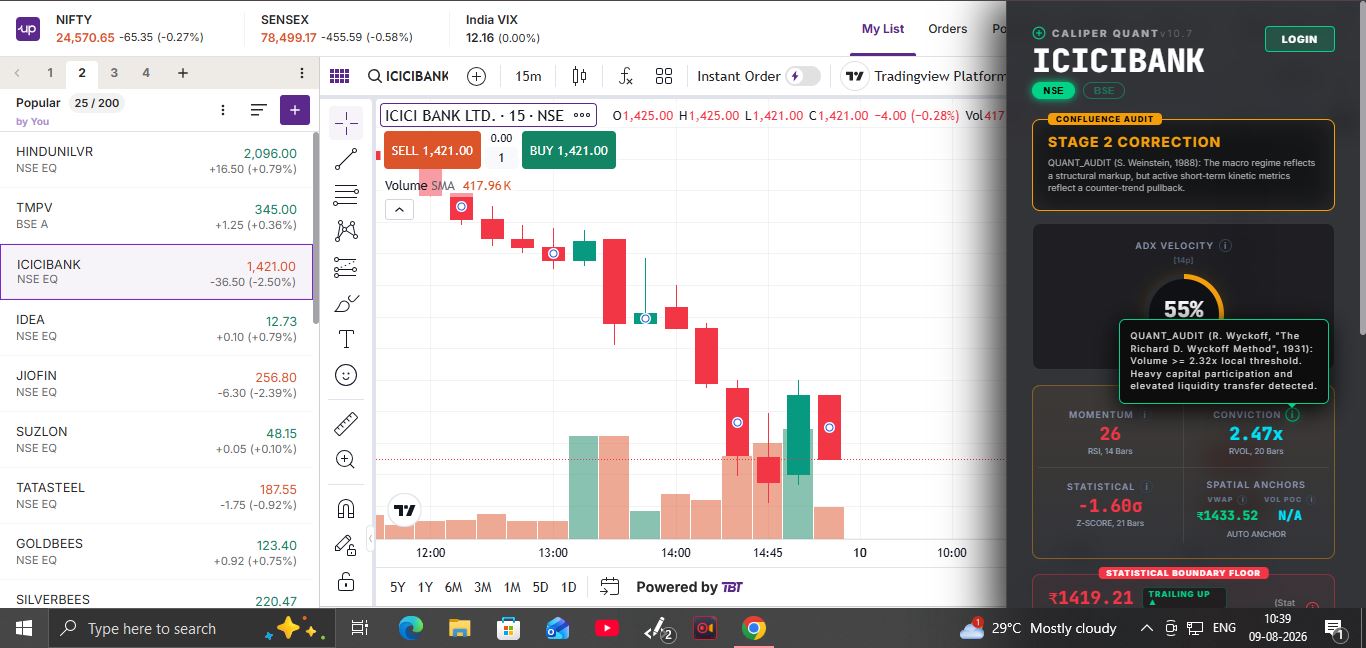
- ADX: 55% (Velocity Exhausted/Climax)
- RVOL: 2.47x (Wyckoff Anomaly)
The Tactical Synthesis
By cross-referencing the two clocks, the system provides a perspective directly derived from observed market data without black-box inference. The 15-minute engine observes via the Wyckoff RVOL threshold and maxed-out ADX that the sell-off has reached peak climax. The 30-minute engine verifies this absorption by calculating a Wilder Bullish Divergence. Crucially, the 15-minute floor flipping to "Trailing Up" provides a dynamically calculated volatility reference (₹1419.21) that the operator may use when independently assessing risk.
Direct API Routing Nodes
How CALIPER prioritizes and fetches live market telemetry.
// Broker Node Hierarchy
CALIPER is currently in the process of integrating directly with brokerages to remove API dependency via direct OAuth OHLCV data transfer for users. During this transitional phase, the engine bridges to your broker's raw data feed via local API nodes. The engine ranks these current nodes based on data completeness:
- 1. UPSTOX (Primary Preference): Robust REST API v3 / WebSocket integration delivering flawless historical depth and full Indian Index support.
- 2. ZERODHA KITE (Secondary): High-stability WebSocket feed with official Kite Connect OAuth integration.
- 3. ANGEL ONE (Tertiary): Excellent for equity audits using standard OAuth dialogs.
- 4. DEFAULT (Native Feeds): Resilient fallback node with automated rate-limiting queues.
// Autonomous Polling Physics
When active intraday lenses are armed, the background worker monitors high-frequency shifts in real time.
- Direct API Speed: Pings market feeds every ~25 to 35 seconds for instant execution updates.
- Default Speed: Downshifts to ~55 to 70 seconds with jitter to protect connection stability.
- The 14-Minute Curfew: Autonomous polling automatically pauses after 14 minutes of user inactivity to optimize system resource usage.
Frequently Asked Questions
Operational limitations, system features, and architectural capabilities.